
World Happiness Report Dashboard
Coursework · Solo · 2025
Power BIData VisualizationWorld Happiness ReportMapsKPIs
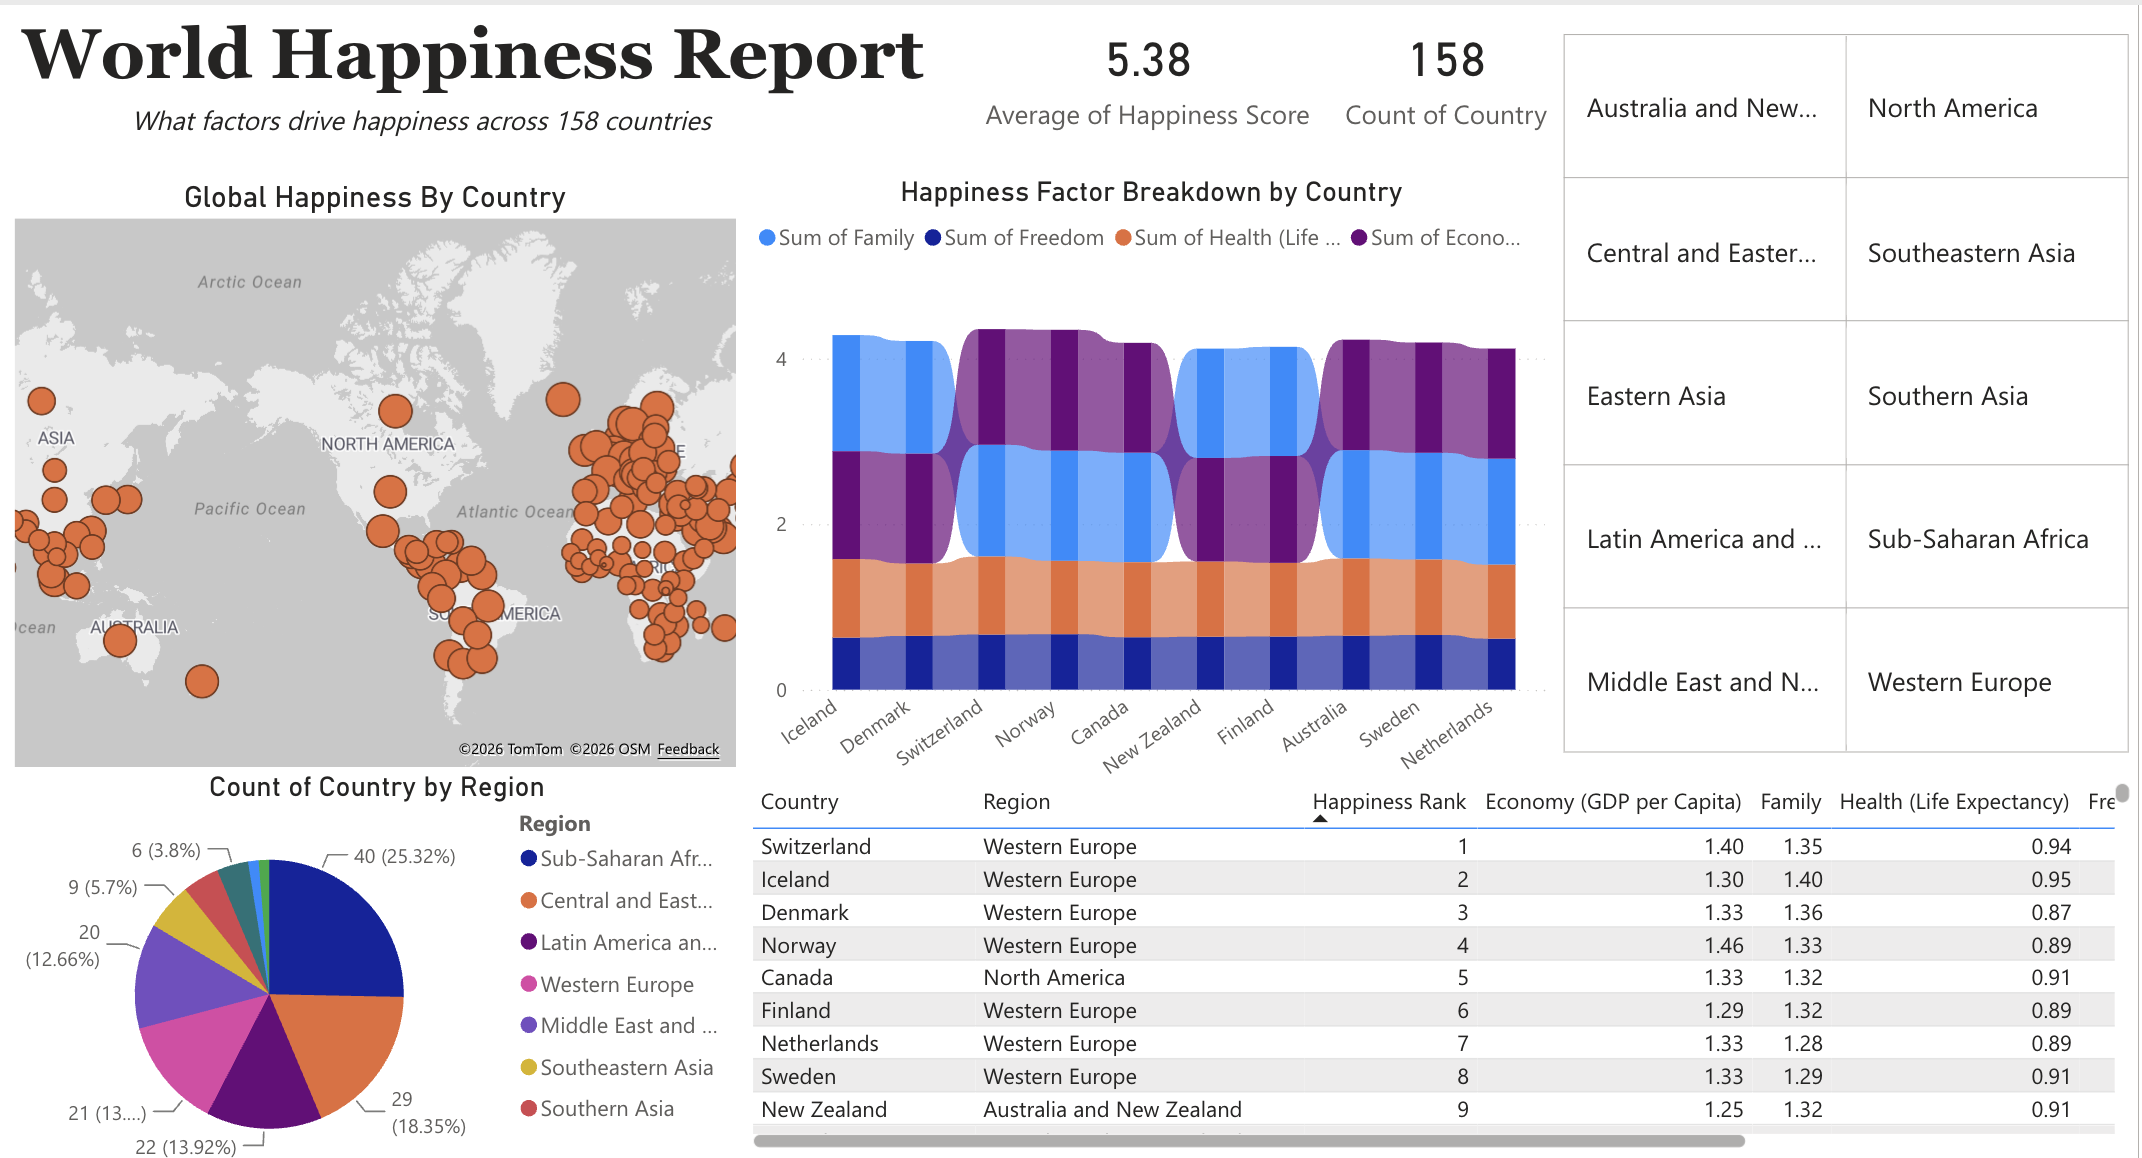
I built this dashboard in Power BI to explore the World Happiness Report and break down what factors drive happiness around the world. I started with the assumption that the happiest countries would be the ones with the strongest economies, but the data showed something different. The countries at the top of the rankings all scored well across the board on family, freedom, health, and economy together. It was not just money.
- Global happiness map by country
- Stream chart breaking down the four happiness factors across top ranked countries
- Regional pie chart
- Sortable country level table